Use deep learning to differentiate between honey bees that are and aren’t carrying pollen.
Bee pollen is a ball or pellet of field-gathered flower pollen packed by worker honeybees, consisting of simple sugars, protein, minerals and vitamins, fatty acids, and other components in small quantities. This is the primary food source for the hive.
This article aims to use deep learning to differentiate between images of honey bees carrying pollen and those that aren’t.
These deep learning models can prove useful in bee farming for analysis/inference generation.
The implementation of the idea on cAInvas — here.
The dataset
Citation:
Ivan Rodriguez, Rémi Mégret, Edgar Acuña, José Agosto, Tugrul Giray. Recognition of pollen-bearing bees from Video using Convolutional Neural Network, IEEE Winter Conf. on Applications of Computer Vision, 2018, Lake Tahoe, NV. https://doi.org/10.1109/WACV.2018.00041
This image dataset has been created from videos captured at the entrance of a bee colony in June 2017 at the Bee facility of the Gurabo Agricultural Experimental Station of the University of Puerto Rico.
The dataset consists of high-resolution images of individual bees on the ramp. The dataset folder in the notebook has the following content —
- images folder — Contains 300×180 resolution images of bees of both categories. The image file names contain the categories — P (for pollen) or NP (for non-pollen).
- pollen_data.csv — A .csv file containing the image names and corresponding labels.
A peek into the pollen_data.csv file —
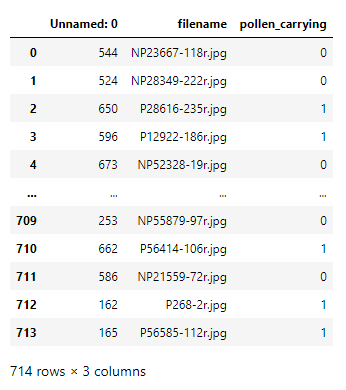
The dataset has 714 images divided into 2 categories.
The ‘Unnamed: 0’ column is unnecessary and can be removed.

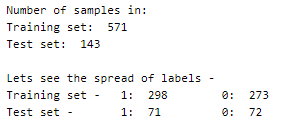
Looking into the spread of category values in the dataset —

This seems to be a fairly balanced dataset.
Here are a few images of both categories from the images folder.
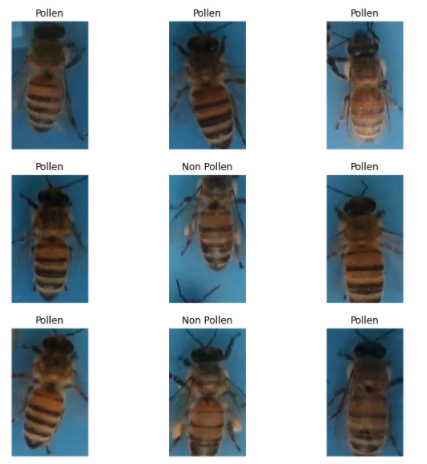
There are no visually separable features to help us differentiate between the honey bees.
The X and y arrays that correspond to the input and output of the model are built from the images folder with the help of the CSV file.
The above function returns the X array with 714 elements, where each element is the normalized pixel values of each image.
The images in the dataset are of size 300×180 with 3 channels. Thus the shape of X will be (714, 300, 180, 3).
Similarly, the y array can be built directly using the ‘pollen_carrying’ attribute of the CSV file. The shape of the y array will be (714,).
The train and test sets are created using an 80–20 split on the original dataset.
The model
The model has four pairs of Conv2D-MaxPooling2D layers followed by a Flatten layer that reduces the values to a 1D array. A Dropout layer is used followed by two Dense layers, one with ReLU and the other with sigmoid activation.
The model is compiled with Adam optimizer with a learning rate of 0.001.
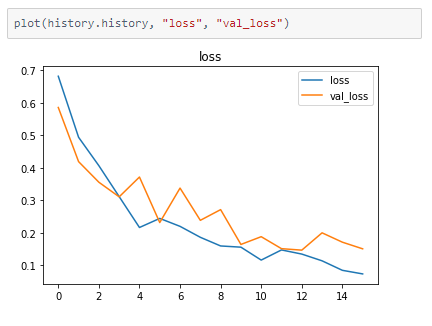
The binary cross-entropy loss is used as the last layer has sigmoid activation.
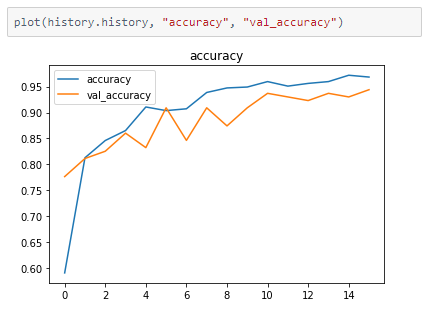
The accuracy of the model on the data is tracked.
The model achieves 94.4% accuracy on the test set after training for 16 epochs.

The metrics
Prediction
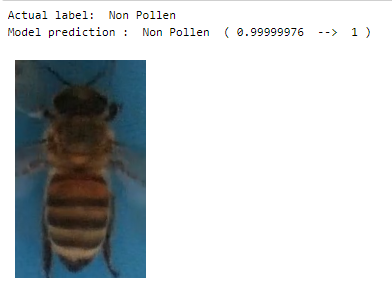
Visualizing the predictions of random values in the test set.
deepC
deepC library, compiler, and inference framework are designed to enable and perform deep learning neural networks by focussing on features of small form-factor devices like micro-controllers, eFPGAs, CPUs, and other embedded devices like raspberry-pi, odroid, Arduino, SparkFun Edge, RISC-V, mobile phones, x86 and arm laptops among others.
Compiling the model with deepC to get .exe file —

Head over to the cAInvas platform (link to notebook given earlier) and check out the predictions by the .exe file!
Credit: Ayisha D
Also Read: Assessing the grade and quality of fruit — on cAInvas
