Detecting whether a human is experiencing a positive, negative, or neutral emotion based on EEG brainwave data analysis

Brain cells communicate with one another through electrical signals.
EEG, which stands for electroencephalography, is a method to record the electrical activity of the brain using electrophysiological monitoring.
This is done through non-invasive (in most cases) electrodes placed along the scalp that records the brain’s spontaneous electrical activity over a period of time.
Monitoring this activity is used for diagnosing or treating various disorders like brain tumors, stroke, sleep disorders, etc.
In this article, we implement a deep learning model to monitor the EEG data and derive inferences regarding the emotions.
Link to the implementation on cAInvas — here.
The dataset
The data was collected from two people (1 male, and 1 female) for 3 minutes per state — positive, neutral, and negative. A Muse EEG headband recorded the TP9, AF7, AF8, and TP10 EEG placements via dry electrodes. Six minutes of resting neutral data were also recorded.
The stimuli used to evoke the emotions are below
1. Marley and Me — Negative (Twentieth Century Fox) Death Scene
2. Up — Negative (Walt Disney Pictures) Opening Death Scene
3. My Girl — Negative (Imagine Entertainment) Funeral Scene
4. La La Land — Positive (Summit Entertainment) Opening musical number
5. Slow Life — Positive (BioQuest Studios) Nature timelapse
6. Funny Dogs — Positive (MashupZone) Funny dog clips
Dataset citation:
J. J. Bird, L. J. Manso, E. P. Ribiero, A. Ekart, and D. R. Faria, “A study on mental state classification using eeg-based brain-machine interface,”in 9th International Conference on Intelligent Systems, IEEE, 2018.
J. J. Bird, A. Ekart, C. D. Buckingham, and D. R. Faria, “Mental emotional sentiment classification with an eeg-based brain-machine interface,” in The International Conference on Digital Image and Signal Processing (DISP’19), Springer, 2019.
Looking into the dataset values —
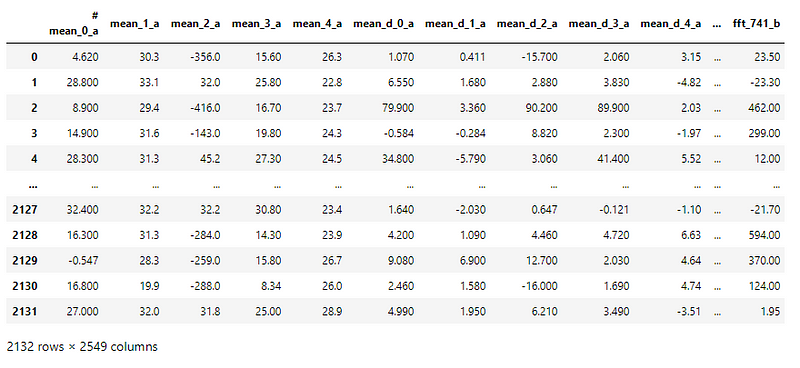
The CSV file has 2132 samples, each with 2548 input columns and 1 output column that indicates the emotion.
Let’s look at the spread of values among the different classes.
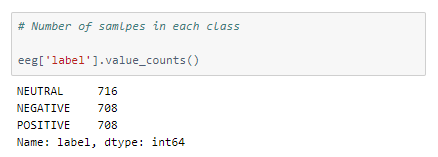
It is a fairly balanced dataset.
Preprocessing the dataset values
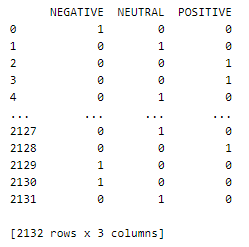
The emotion attribute of the CSV file has three categories and is one-hot encoded to give as the model’s output.
The values of the input attributes are not in the same range.
The MinMaxScaler function of the sklearn’s preprocessing library is used to scale the values in the range [0,1].
Since the validation and test set values are used to tune and evaluate the performance of the model respectively on unseen data, the MinMaxScaler is fit to the values in the train set and then used to scale the values of the val and test sets.
The data is split in the 80–10–10 ratio and then divided into x and y.

Now that we have the X and y arrays for train, val, and test sets, we can scale the values using the MinMaxScaler.
The model
This is a simple model with only dense layers.
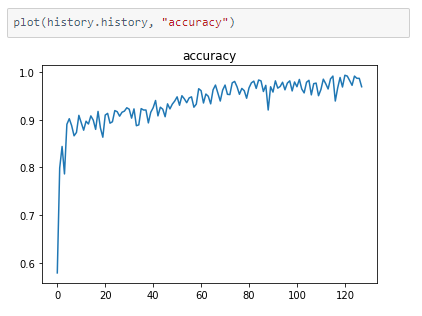
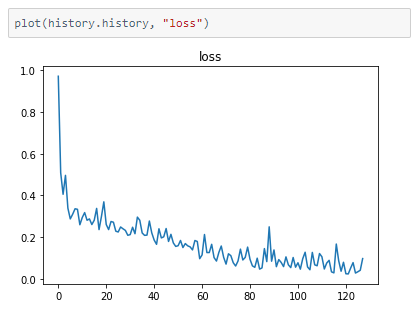
The accuracies seem to fluctuate a little towards the end and we ended up with a model that is 88% accurate.

The metrics
deepC
deepC library, compiler, and inference framework are designed to enable and perform deep learning neural networks by focussing on features of small form-factor devices like micro-controllers, eFPGAs, CPUs, and other embedded devices like raspberry-pi, odroid, Arduino, SparkFun Edge, RISC-V, mobile phones, x86 and arm laptops among others.
Compiling the model with deepC to get .exe file —

Head over to the cAInvas platform (link to notebook given earlier) and check out the predictions by the .exe file!
Credit: Ayisha D
Also Read: Abalone age prediction — on cAInvas
