Predicting the age of abalone (sea snails) from their physical measurements.

Abalone is a common name for sea snails. Determining their age is a detailed process. Their shell is cut through the cone, stained and the rings are counted using a microscope.
This is a time-consuming process that can be simplified by using neural networks to predict their age using the physical measurement of the abalone.
Here, we use measurements such as length, height, weight, and other features to predict their age.
Implementation of the idea on cAInvas — here!
The dataset
Data comes from an original (non-machine-learning) study: Warwick J Nash, Tracy L Sellers, Simon R Talbot, Andrew J Cawthorn and Wes B Ford (1994) “The Population Biology of Abalone (Haliotis species) in Tasmania. I. Blacklip Abalone (H. rubra) from the North Coast and Islands of Bass Strait”, Sea Fisheries Division, Technical Report №48 (ISSN 1034–3288)
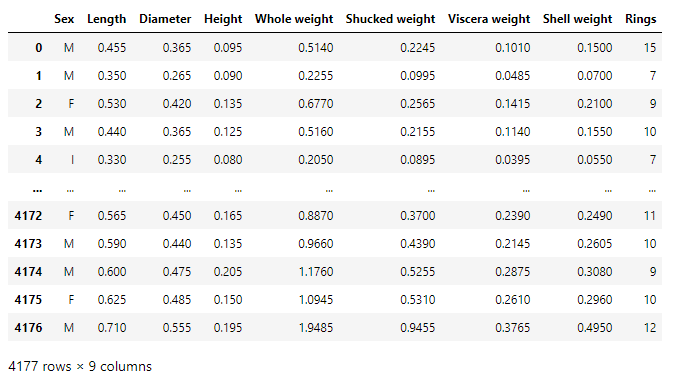
The dataset is a CSV file containing features of 4177 samples. Each sample has 9 features — Sex, Length, Diameter, Height, Whole weight, Shucked weight, Viscera weight, Shell weight, Ring. Out of these, Ring is the target variable and adding 1.5 to the ring attribute gives us the age of the abalone,

Preprocessing
Encoding the input columns
Of the 8 input columns, ‘Sex’ is a category attribute with values that have no range dependency. Thus it is one hot encoded using the get_dummies() function of the pandas library. The drop_first parameter is set to True.
This means that if there are n categories in the column, n-1 columns are returned instead of n. i.e., each value is returned as an n-1 value array. The first category is defined by an array with all 0s while the remaining n-1 category variables are arrays with 1 in the (i-1)th index of the array.
The one-hot encoded columns are appended to the data frame while the original ‘Sex’ attribute column is dropped.
Encoding the output columns
Rings is an attribute with continuous values ranging from 1 to 29. These are split into 3 categories — young (less than 10), middle age (between 10 and 20), old (between 20 and 30).
A peek into the spread of values across the categories —

The dataset is imbalanced with very few values in the ‘old’ category.
The Rings attribute is again one-hot encoded, with drop_first = False, resulting in 3 target columns — young, middle age, and old. The original rings column is then dropped.
Train-validation-test split
Defining the input and output columns for use later —
There are 9 input columns and 3 output columns.
Using an 80–10–10 ratio to split the data frame into train-validation-test sets. The train_test_split function of the sklearn.model_selection module is used for this. These are then divided into X and y (input and output) for further processing.
Standardization
The standard deviation of attribute values in the dataset is not the same across all of them. This may result in certain attributes being weighted higher than others. The values across all attributes are scaled to have mean = 0 and standard deviation = 1 with respect to the particular columns.
The StandardScaler function of the sklearn.preprocessing module is used to implement this concept. The instance is first fit on the training data and used to transform the train, validation, and test data.
The model
The model is a simple one with 3 Dense layers, 2 of which have ReLU activation functions and the last one has a softmax activation function that outputs a range of values whose sum is 1 (probability values for various categories).
As it is a classification problem with one-hot encoded target values, the model is compiled using the categorical cross-entropy loss function. The Adam optimizer is used and the accuracy of the model is tracked over epochs.
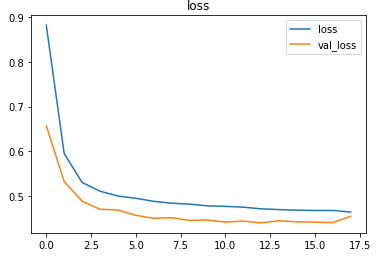
The EarlyStopping callback function of the keras.callbacks module monitors the validation loss and stops the training if it doesn’t decrease for 5 epochs continuously. The restore_best_weights parameter ensures that the model with the least validation loss is restored to the model variable.
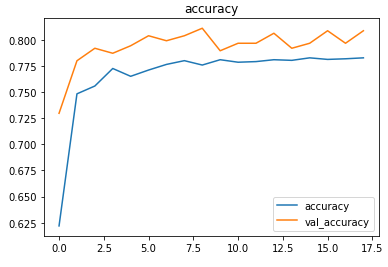
The model was trained with a learning rate of 0.001 and an accuracy of ~80% was achieved on the test set.

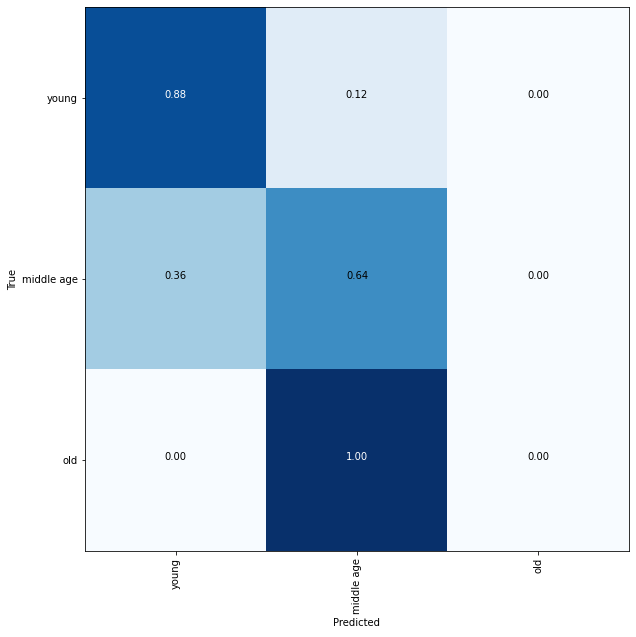
Plotting a confusion matrix to understand the results better —

A balanced dataset along with other attributes such as weather patterns and location (hence food availability) can help in classifying them better.
The metrics


Prediction
Let’s perform predictions on random test data samples —

deepC
deepC library, compiler, and inference framework are designed to enable and perform deep learning neural networks by focussing on features of small form-factor devices like micro-controllers, eFPGAs, CPUs, and other embedded devices like raspberry-pi, odroid, Arduino, SparkFun Edge, RISC-V, mobile phones, x86 and arm laptops among others.
Compiling the model using deepC —

Head over to the cAInvas platform (link to notebook given earlier) and check out the predictions by the .exe file!
Credits: Ayisha D
You may also be interested in
- Learning more about Hate Speech and Offensive Language Detection
- Reading about Fingerprint pattern classification using Deep Learning
- Also Read: Fetal health classification — on cAInvas
- Finding out about Deep Learning, the technology enabling machines to interpret complex data and mimic human cognition
Become a Contributor: Write for AITS Publication Today! We’ll be happy to publish your latest article on data science, artificial intelligence, machine learning, deep learning, and other technology topics.
